.jpg)
Optimism $OP Bulls Are Getting Ready to Take Over
Optimism is a Layer 2 Optimistic Rollup network designed to utilize the strong security guarantees of Ethereum while reducing its cost and latency. In today’s article, we’ll take a look at the technical chart for its token $OP and explore the potential bullish path based on the Elliott Wave Theory.
NVIDIA (NVDA) Buying The Dips After Elliott Wave Double Three Pattern
Hello fellow traders. In this technical article we’re going to take a look at the Elliott Wave charts charts of NVIDIA (NVDA) Stock published in members area of the website. Our members are aware of the numerous positive trading setups we’ve had among Stocks and Indices recently.
Elliott Wave Analysis Favors DAX to Extend Higher
Short Term Elliott Wave View on DAX suggests rally from 10.23.2023 low is unfolding as a 5 waves impulse. Up from 10.23.2023 low, wave (1) ended at 17003.28 and dips in wave (2) ended at 16345.02. The Index extended higher in wave (3) towards 18567.16 as the 1 hour chart below shows.

Crypto Traders Are Nervous About the Bitcoin ETF Outflows, But They Should Pay Attention To This
Crypto traders have started to become a bit worried as the tail wind which was very much keeping rally going has certainly fainted and traders are scratching their heads with they look at recent headlines about the on-going outflows from Bitcoin ETF- a facto which provided hope to many that we are just in an early days of crypto rally. Here is more on this

Elliott Waves On AUDUSD: Short-term Dirrection Is Pointing Higher
The Aussie (AUDUSD) is currently in an uptrend this week, making five waves up from the 0.6363 low, establishing this as our invalidation level. As long as this level is not breached, we expect further upside for AUDUSD.

Gold Price Retraces From Its All Time High, How Low Can It Go?
The price of shinning metal is trading lower as investors continue to be more risk-takers in comparison to the previous weeks, when we saw the price of shinning metal rise through the roof. The metal is on track to post its first weekly loss in 5 weeks, but it may be a little premature to say this as we are only mid-week and some important economic data is about to hit the tape.
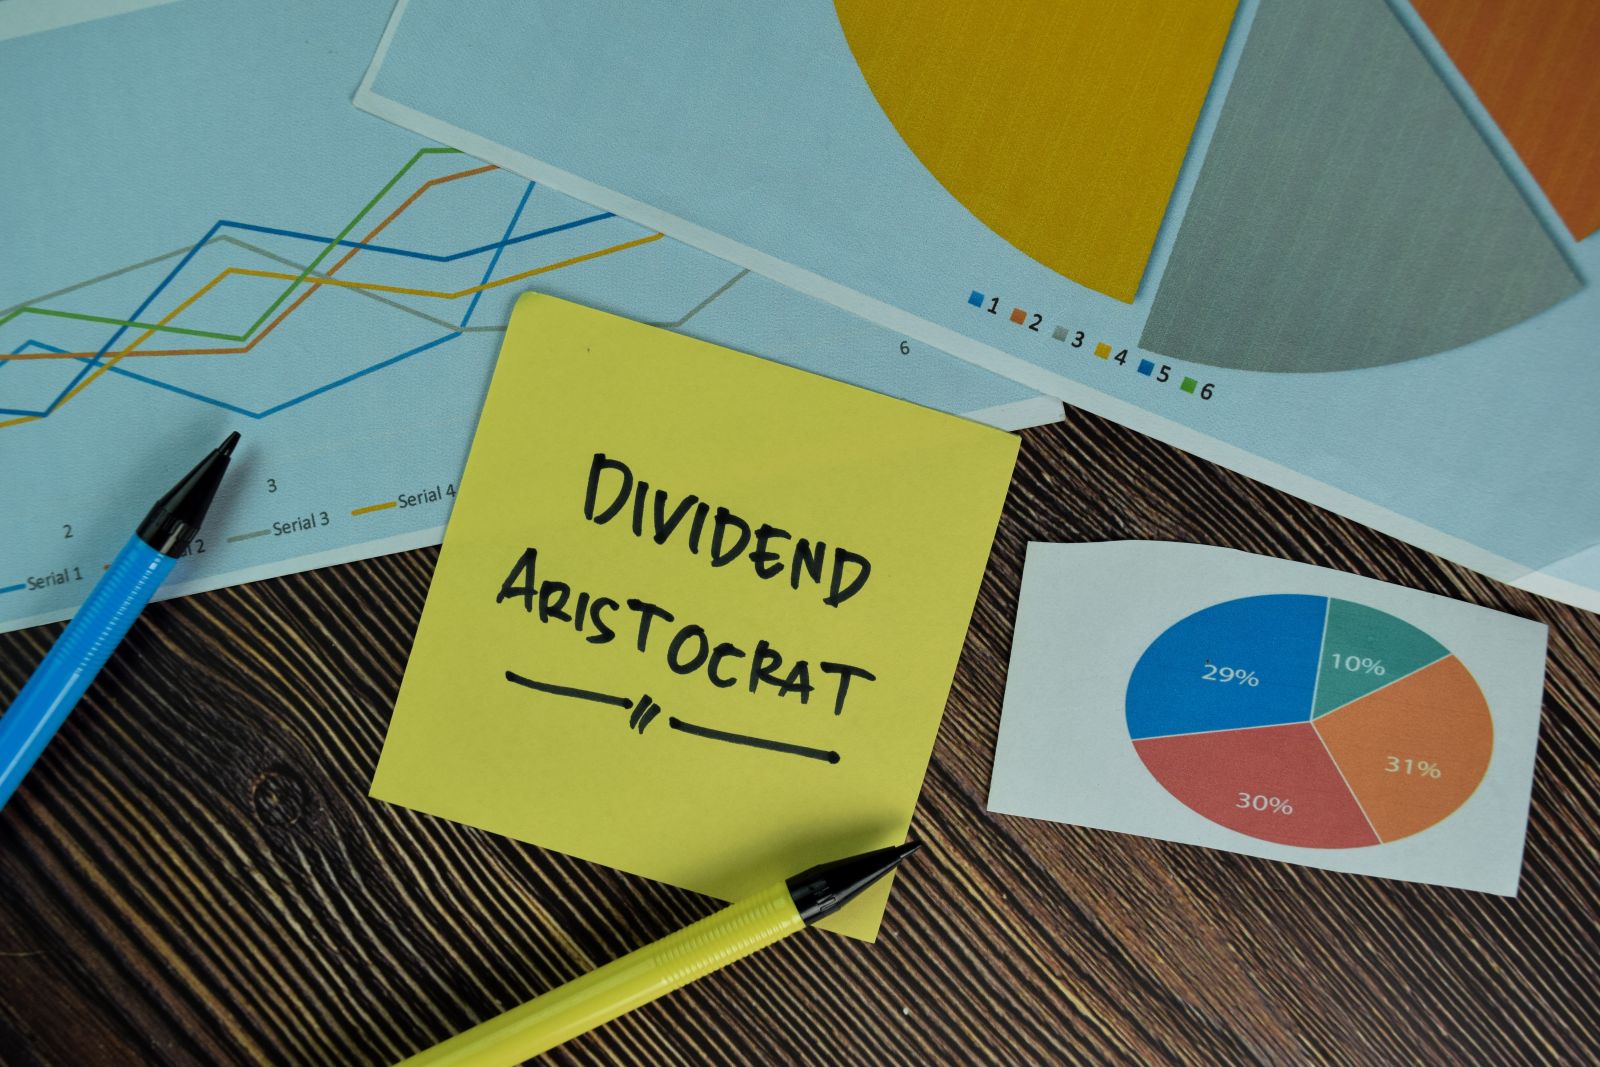
3 Top Dividend Aristocrats For 2024
Dividend Aristocrats have increased their dividends for at least 25 years.

Oats measured after roll to July expiration
We analyze a potential trade with Oats

Soybeans looking attractive
We provide technical analysis on Soybeans
TLT Is Coming Into Key Support Within A Corrective Decline
TLT Is Coming Into Key Support Within A Corrective Decline, from where we should be aware of a continuation higher.
Elliott Wave Intraday Analysis on GBPUSD Shows 5 Waves Bullish Impulse
Elliott Wave view on (GBPUSD) suggests that rally from 10.4.2023 low takes the form of an impulsive structure. Up from 10.4.2023 low, wave (1) ended at 1.2828. Correction in wave (2) unfolded as an expanded flat Elliott Wave structure. Down from wave (1), wave A ended at 1.2519 and wave B ended at 1.2894

Staying Ahead of the Yield Curve
Learn more about the popular 2/10 spread and how you can trade a steeper or flatter curve with futures contracts.

Grain Spreads: Beans Hit 50% Retracement
Beans Hit Target and Fail for Now

Crude Oil Volatility with Geopolitical Events
How might geopolitical event affect crude oil and other commodities? Since implied volatility is a measure of future uncertainty and anxiety, it can be used to help to understand the long term effects of geopolitical events on the market, both current, and for months in the future (using the implied volatility forward curve). The shape of the curve, as well how much it has shifted, can then imply how seriously the market might be taking each geopolitical event.

Pure Hedge - Livestock and Grain
Wild Markets on the Horizon